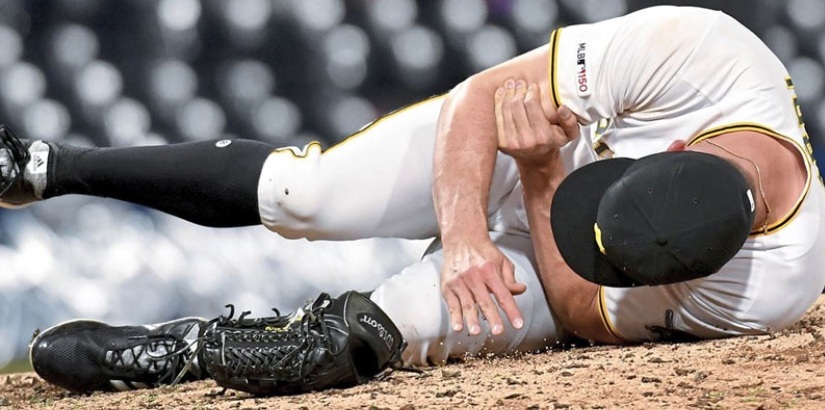
Pitching injuries in MLB are up. Way up! We covered MLB pitching injuries from a couple of angles previously (here and here), but this article from a year ago shows the mounting evidence. Specifically, this chart from that same article clearly shows a steady increase of pitching injuries over the past twenty years.

The article sums up the predicament faced by MLB and pitchers by stating, the study (pitcher injury study commissioned by MLB) asserts that the pursuit of velocity and max-effort pitching are the “primary forces driving the long-term increase in pitcher injuries.”
The ramification of all teams’ pursuit of pitch velocity above all else has created an environment of constant visits to the injured list (IL) for many of today’s star pitchers. In addition, most pitchers only throw on average about six innings per game, so the chance to see your favorite hurler has decreased greatly over time. Today’s innings leaders barely throw more than 200 innings per year. Compare that figure to 25 years ago, where inning leaders were throwing about 250 innings per year or 25% more than today. To find the last pitcher to throw 300 innings you have to go all the way back to 1980, which was Steve Carlton (304) of the Philadelphia Phillies.

Overall this trend is not a good one for baseball as it limits fans from seeing the most talented starting pitchers throughout the year due to ever increasing trips to the IL. This emphasis on pitch velocity over the past decade coincides with the ramping up of analytics used by MLB teams. The use of analytics also calls for strict pitch counts that limit starting pitchers in many instances from going past six innings of work before turning the rest of the game over to “fresh” relief pitchers.
Therefore, analytics has created this “newish” baseball world of increased injuries, use of multiple relief pitchers every game, shortened starter appearances, along with the sharp reduction in complete games by starting pitchers. For context, here is a breakdown of complete game totals for the years 1965, 1985, 2005 and 2025:
| Year | MLB Complete Games |
| 1965 | 739 |
| 1985 | 627 |
| 2005 | 189 |
| 2025 | 29 |
Note that in 1965 Don Drysdale of the Los Angeles Dodgers started a league leading 42 games that year and also finished almost half his starts with 20 complete games. Both those figures would be unheard of nowadays.

BP does not advocate against analytics. We stated ad nauseam our disdain for the rule changes (i.e. pitch clocks, ghost runners, etc.), but using analytics to provide a competitive advantage is something that we cannot argue against nor should there be rules to prevent incorporating analytics into team’s in game strategy. With that said, and perhaps being a bit overly nostalgic, we believe analytics as a whole has led to the unintended consequences of creating a game less visually appealing and interesting.
How so, you might ask? Well, here are a couple of additional point just to make our case:
- We previously covered the sharp reduction in complete games, which in our opinion is a disappointing trend. In addition, to take this a step further, the strict allegiance to pitch counts has increased the likelihood of combined no-hitters (more than one pitcher used) today, where previously they were almost unheard of in baseball. For example, in 2023 and 2024 there were eight no-hitters and two of those or 25% were combined (there were not any no-hitters in 2025). Some might not have an issue with this trend, but our thought is that “there is something inherently satisfying to cheer on your team’s starting pitcher in a complete game no-hitter as opposed to having multiple pitchers involved in such an effort”.
- The emphasis on velocity has also led to a marked increase in strikeouts, which we previously covered here. Strikeouts are obviously a part of the game, but probably the most interesting action in any game occurs with batted balls in play. Nowadays, there are more than 40,000 strikeouts in a season. To put that in perspective, 20 years ago that figure was 25% less (~30,000 per season) and 30 years ago it was about 38% less (25,000 per season). Check out this link for the full history of strikeouts.

MLB solely blamed the length of the games as the reason for decreases in attendance and rammed through rule changes to address only that aspect. Is this simplistic approach the correct one or are there instead multiple factors such as the aforementioned injuries to star players, restrictive pitch counts, and reduced ball in play excitement/suspense that have dulled interest in the game?
In upcoming posts, we will delve further into this question.

Leave a Reply to AnonymousCancel reply